
rvlsoft - Fotolia
14 top mobile app KPIs that advance development
No matter its purpose, a mobile application must meet expectations from users and corporate stakeholders. Here are 14 mobile app KPIs that you need to know.

Users notice everything about mobile application performance, from launch speed to the simplicity of tasks. In turn, software development and support teams need to find ways to improve performance in every aspect.
Key performance indicators (KPIs) are metrics that organizations can use to track and target places to improve. Software teams should be able to tie each KPI to business initiatives or stated business values.
However, specific KPIs will vary from one project to another. For example, a manufacturer's shop floor inventory check-in app must launch quickly and provide an efficient user experience, but there's no direct revenue to consider. By contrast, a mobile game needs to attract increasing numbers of active users, focusing on high retention rates.
Software teams should review the different types of mobile app KPIs and plan which ones they should track from the start of a project to improvement implementation. Here, we'll discuss some fundamental KPI metrics, categorized by user base, performance, engagement and monetization.
Top mobile app KPIs explained: User base
Downloads. The number of mobile users that download an application indicates how a potential user base is growing, or the effectiveness of consumer-facing application marketing campaigns. For internal applications, a review of app download rates can help the enterprise adjust their user interaction.
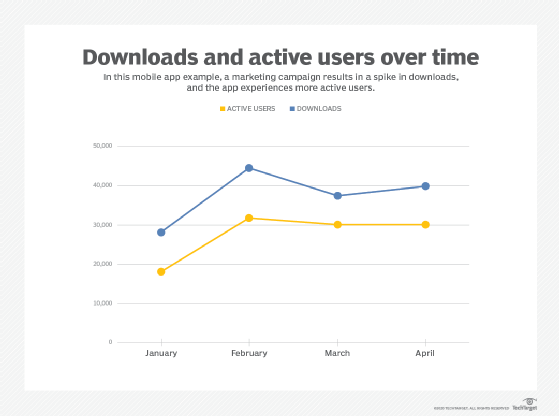
But downloads are not a standalone metric to judge if an application is already successful. Adjust expectations for downloads over time -- as the market becomes more saturated, the growth percentages will level off. A sharp decline in downloads could indicate bad reviews, a new competitor with an attractive offering or even a problem with the app store.
Retention rate. The retention rate shows whether users continue to engage with the mobile app, or if they decide to unsubscribe. By association, it communicates whether users are unsatisfied with the application.
Active users. Active user numbers indicate the number of people who open and interact with an application. Organizations can track numbers of users daily, weekly or monthly. Plan IT capacity to support expected active users throughout a 24-hour cycle, but also consider when users are most likely to use your particular application.
Top mobile app KPIs explained: Performance
App startup time. One of the first things users will notice is how long it takes for an application to open. Startup time metrics measure how long it takes a user to open an application, as well as how long it takes to respond to users as they interact with it. A cold startup takes place when the app is closed and everything needs to load. A hot startup occurs when the app is open, but in the background, and the user summons it.
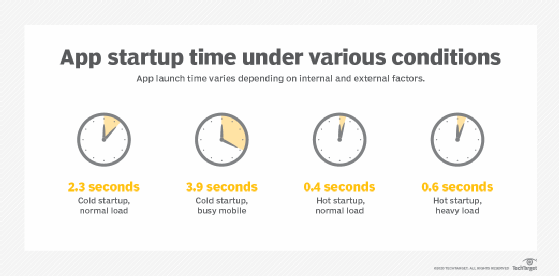
Android's developer documentation lists 5 seconds as the longest acceptable cold startup time, and 1.5 seconds for hot startups. Test app launch times in all scenarios, such as when the user may have many other resource-intensive applications open simultaneously.
Unresponsive gestures. Once users open an app, they navigate menus, fill in forms and browse content. An unresponsive gesture metric indicates any tap, pinch, swipe or other interaction that doesn't work properly. Mobile app developers should track this KPI to discover faults in the design, such as a menu that overlaps another component or broken UI components.
Lag. Application performance can lag due to incompatibility with the current device OS, underprovisioned back-end infrastructure, or network communication problem. Use application performance monitoring tools to detect lag, and ensure developers get accurate feedback to improve back-end support.
Crashes. Mobile app teams should monitor crashes to identify bug fixes and potential performance shortcomings. Since app developers cannot control the individual user device, they cannot prevent all crashes. However, it's important to remember that lightweight and resilient apps shouldn't experience as many crashes as one that is resource intensive.
Top mobile app KPIs explained: Engagement
Session length. A session is how much time a user spends on a mobile app. In other words, a session starts every time a user with a unique IP address opens an app. Longer sessions are generally positive, but it's all relative. For instance, if an app's purpose is to resolve a complaint or check a user's status for a refund, a longer session could indicate a poor UI and low usability.
Stickiness. Stickiness indicates how often users return to an application during a given time period. An organization with a gaming app, for instance, can measure stickiness as the number of sessions that occur per day. A business productivity app maker might track daily active users divided by monthly active users. Stickiness pairs well with session length as mobile app engagement KPIs. Track stickiness before and after major UI updates to see if users respond well to the change.
Session interval. Session intervals are the length of time between a user's sessions on an app. Users that reopen a social media or news app shortly after they close it indicates that they are highly engaged with the app's content. However, for applications that accomplish a business task, shorter session intervals might indicate there is something wrong with the app.
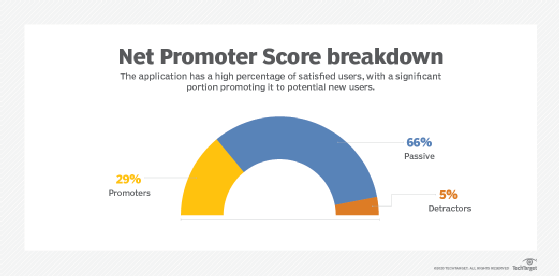
Net Promoter Score. The Net Promoter Score (NPS) is a different kind of mobile app KPI than most on this list, because it requires direct feedback from users rather than data from app monitoring tools. Companies can generate an NPS by directly asking users how likely they are to recommend the app to someone else, typically using an embedded feedback system where users rate the app. User categories based on NPS on a 10-point scale:
- A score of 9-10 indicates the user is a Promoter.
- A score of 7-8 indicates that the user is Passive.
- A score of 0-6 indicates that the user is a Detractor.
Top mobile app KPIs explained: Monetization
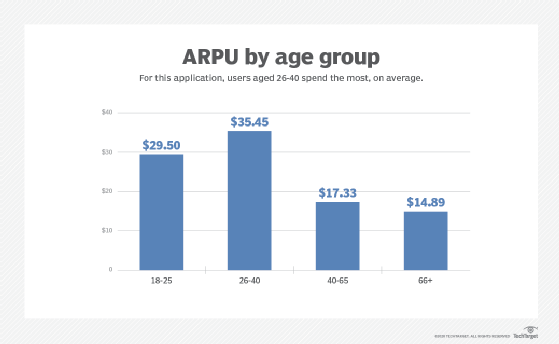
Average revenue per user. Companies that sell services, premium features or goods via a mobile application should track the average revenue per user (ARPU) as a ratio. This requires a simple equation of total revenue generated via the app divided by total users (or total active users). ARPU reveals the response to app updates, such as a new checkout process. It can also indicate the success of a promotional initiative, such as a sale, free shipping offer or an investment in personalization software that targets specific user groups.
Cost per acquisition: This KPI generally refers to how much money a company spends on marketing to attract mobile app downloads. However, not all users are as valuable as others. Consider tracking users in categories, such as those who complete a purchase or fill out a full profile, and how much it cost the company to acquire those users. Some companies also might benefit from dividing the data to see cost per install on different device types or by global region.
Lifetime value: Lifetime value (LTV), is an all-encompassing metric that combines app revenue, user engagement and promotion. This metric will assess users, as opposed to directly tracking application performance. Try pairing ARPU with average churn and factor in the NPS to calculate LTV and determine the value of marketing and app roadmap decisions.