Microservices logging best practices every team should know
Creating a log system for distributed microservices is a task much easier said than done. Joydip Kanjilal offers a few best practices to shore up microservices logging processes.

Application logs simplify problem-solving in support, but teams face several challenges when they try to execute microservices logging, which requires a centralized view of multiple, distributed services.
An application log is an essential component of any application, regardless if it's monolithic or microservices-based, but the fundamental architecture of microservices-based applications makes logging a complicated endeavor. Because of this, enterprises need to follow microservices logging best practices to ensure app performance.
Monolith vs. microservices logging
Logging in a microservices-based application differs from the way logging works in a monolith -- you must adhere to a different set of practices for both.
Logging in a monolith is as simple as writing data to a single log file and viewing it later. In a microservices-based application, you have many different components working together. Services may span across multiple servers, even spread across geographical boundaries. This creates many log files since each microservice maintains its own set of data.
This article is part of
What are microservices? Everything you need to know
Each service in a microservices-based application should have its own monitoring and logging strategy to address issues proactively. More importantly, these log files need to be in proper order to easily debug a problem -- a correlation ID is used to correlate the calls through various microservices. A single logging strategy establishes one place where all logs are stored, rather than dispersing them across multiple services.
Logging in microservices architecture
With microservices, multiple services constantly run and communicate among themselves, generating their own logs along the way. When one or more services fail, the team needs to know which service experienced an issue and why. It's also difficult to decipher the complete request flow in microservices. For instance, which services have been called? And in what sequence and frequency is that service called?
Here a few microservices logging best practices:
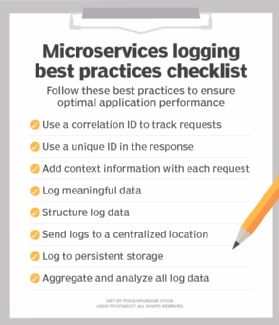
1. Use a correlation ID
A correlation ID is a unique identifier that developers use to segregate sets of operations and track individual requests. It doesn't matter how the correlation ID is generated, so long as it is unique, accessible to downstream services and diligently logged along with other important service call data.
If the transaction passing through multiple services has a correlation ID, troubleshooters can do an ID search in the logs and view data about the individual service calls, including the number of times a service was used. This way, the correlation ID can identify which service the transaction failure stemmed from.
2. Structure logs appropriately
If a microservices-based application uses different structures to log data in their stacks, it can hamper log standardization. For example, one service might use a pipe symbol as a delimiter for fields, while another service uses a comma as a delimiter. This means troubleshooters can't analyze the individual logs in the same manner.
Structured logging is a methodology that creates logs based on a consistent, predetermined message format. It converts the log data to a format that can help developers query, search and analyze the log data seamlessly. Developers should structure an application's log data to simplify parsing and to only log relevant information. This structured logging helps create simple and flexible microservices logs.
The structure of the data being logged is important for tracing, debugging and troubleshooting. When log data is unstructured, it becomes difficult to query, implement alerts or even correlate events. If your log data is properly structured, it is readable and can be easily parsed by automated systems.
3. Provide informative application logs
When an error occurs, the log should include all the needed information pertaining to the issue. The more information troubleshooters have from the microservices' logs, the easier and more quickly they can ascertain what went wrong.
Logs should, at a bare minimum, include the following information:
- Service name
- Username
- IP address
- Correlation ID
- Message received time in UTC
- Time taken
- Method name
- Call stack
4. Visualize log data
When working in microservices-based applications, developers often need to examine the state of an application, as well as information on any issues, downtimes or latency. Teams can add dashboard features that provide a visual depiction of the information carried into the application logs.
Log visualization illustrates aggregated information for the services. This information may include, but is not limited to, requests, responses and size of responses. There are various log visualization tools available, such as Scalyr, Graylog, Kibana and Sematext.
5. Use centralized log storage
Implementing log storage for each distributed microservice is a daunting task, since each service requires its own event logging mechanism. As the number of microservices grows, those mechanisms become increasingly difficult to manage. Individual log storage adds a lot of complexity to log retrieval and analytics.
Instead, send the logs to a single centralized location for easy accessibility. Aggregation makes it easier for teams to manage and coordinate log data. Maintaining this central repository also helps investigate problems and correlate them to specific services. For instance, developers can search and analyze logs, as well as configure alerts that are triggered as soon as certain messages are stored in the logs.
Log aggregation and management tools
There are several tools for log aggregation and management which can simplify collection and help provide real-time insights into application performance. Some of the top tools include:
- Fluentd. This open source window-based data collection tool can unify data collection and consumption. It takes advantage of standard built-in parsers, and developers can use NLog to log data to a Fluentd node. Fluentd is often used by Docker and Elasticsearch users.
- Logstash. This is a lightweight, open source, server-side log aggregator that can work in windows and is used to collect, integrate and parse logs. Logstash consumes much less memory than Fluentd.
- Rsyslog. This is a high-performance, modular, secure log processing framework. It supports TCP, TLS and SSL protocols and is compliant with MySQL, PostgreSQL and Oracle databases.
- Loggly. This is a popular log analysis and monitoring solution that is adept at logging data from Docker containers. The data captured by Loggly can be used to monitor, analyze and optimize microservices-based applications.
6. Query logs
The ability to query logs efficiently is an essential part of finding failures that occur across multiple microservices. Using the correlation ID, a developer or tester should be able to access the complete request flow within the application.
Teams can query the log data to find out the percentage of failed requests, the time taken by each request and the frequency of each service call. One way to supplement this is to use a tool that can aggregate log data, such as the ELK stack, Splunk or Sumo Logic.
7. Handle failures
Application deployments should rely on an automated alert system that can analyze the logs and send out alerts whenever something goes wrong with one or more services.
Developers should also consider the timing of failures, because it's possible that a logging component might be down at a certain time of the day due to high logins or automated processes. Lastly, applications should always include a fallback service that's adept at handling logging failures and restoring log data, if needed.