
Getty Images
The 4 Golden Signals, and how to put them into practice
There's nothing easy about monitoring distributed systems, but the right metrics can help. Here's how to put the Golden Signals of software reliability to work.

The practice of enforcing software reliability involves monitoring performance and taking corrective action when things go wrong. To do that effectively, systems need built-in "tripwire" metrics that trigger alerts and prompt teams to deploy reparative countermeasures when things go wrong.
The Golden Signals have evolved to address the factors that most impact distributed systems like microservice-based architectures. These metrics primarily revolve around outward-facing concerns like user request/response times, resource utilization and memory allocation.
Let's examine this approach to systems monitoring, including the four specific metrics it targets, the unique details these metrics reveal, and a quick look at how the Golden Signals might come into play in a microservices environment.
Golden Signals
Many performance measures revolve around things like CPU utilization, memory allocation, disk-drive read times or internal bandwidth capacity. To consistently keep track of end-user experiences, Google's team of software reliability engineers (SREs) created a standard set of four metrics known as the Golden Signals: latency, traffic, errors and saturation.
Latency. This metric is the time that elapses between when a system receives a request and when it sends a response. It is tempting to think of this metric as a single "average" latency, or perhaps an established "mean" latency that can be used to guide service-level agreements. But, in the Golden Signals, we want to look at the latency over a period of time, which we can visualize with something like a frequency-distribution histogram.
The histogram below documents the latency of 1,000 requests made to a service with an expected response time of under 80 milliseconds (ms). Each section of the histogram groups requests together by the amount of time they take to complete, ranging from 0 ms to 150 ms in increments of five.
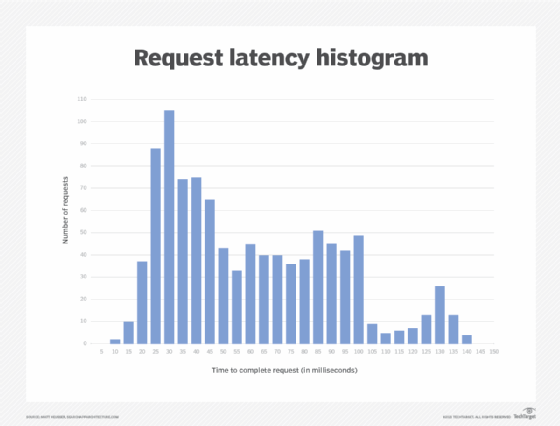
This graph shows us that, of these 1,000 requests, most requests (105, to be exact) took about 25 ms to 30 ms to complete. A roughly even number of requests are shown to take between 50 ms to 100 ms, but this drops off drastically at 105 -- that is, until we see a second small spike around the 130 ms mark.
The service has an average latency of 58 ms and a median latency of 45 ms, which is comfortably within the range for which we're looking. Yet, there is still this significant uptick on the right side. As such, this histogram gave us a specific reason to investigate these latency-prone requests and possibly remedy the issue.
Golden Signals vs. USE metrics
Those studying various monitoring techniques are likely to encounter another set of application performance metrics: The USE metrics. They're similar to the Golden Signals, but the perspective they provide aligns to a different goal.
USE stands for utilization, saturation and errors. Utilization indicates the time an application service is processing workloads, while saturation is the backlog of unprocessed work that resides within the application's internal systems. The "saturation" metric found in the Golden Signals corresponds to USE's utilization metric. However, the Golden Signals approach doesn't lend itself to distinguishing customer errors from internal errors. The USE metrics do.
Whether or not these distinctions are worth considering depends on the system you work with -- more importantly, how it fails. If a team wants to scan a back-end system for bottlenecks, but without including the backlog that still resides externally, the USE metrics might be suitable.
Traffic. Traffic is demand on the system. For example, a system might average 100 HTTPS requests per second. Again, averages can be deceptive; you might look at trends for the average to detect problems, or the averages over time. It is possible that traffic widely increases at certain times of day, such as people checking stock prices as the market closes. Perhaps the delays at the right side of the latency diagram discussed above all occur at this particular time.
Errors. API error codes indicate something is wrong. Tracking both the total number of errors that occur and the percentage of failed requests allows a team to compare the service to others. Google's SREs expand this concept of errors to include functional errors of incorrect data and slow responses, even if the service returns a "200 OK" message.
Saturation. Networks, disks and memory have a saturation point at which demand exceeds a service's performance limits. You can use load testing to identify that saturation point, as well as the constraint, which is the request that failed first. Unfortunately, it's easy to ignore saturation when load balancers and other automated scaling mechanisms are in place. However, misconfigured systems, inconsistent scaling and other factors can always prevent load balancers from doing their job. Monitoring saturation can help teams identify issues before they become serious problems, as well as reconfigure their strategy to prevent them from recurring.
The Golden Signals and microservices
A microservices architecture that supports an e-commerce application might use an API Gateway as a single public interface for requests, and a composition pattern that combines requests into groups. The most valuable metrics in this case would be how quickly querying customers receive results (latency and traffic), if those results are correct (errors) and if the hardware can handle the incoming requests (saturation). Thus, the four Golden Signals would make for a useful batch of microservices monitoring metrics.